Wednesday, March 18, 2009

Examples of Information/Instructional Design

The following are just a few examples of the types of well worked information/instructional design graphics that exist:

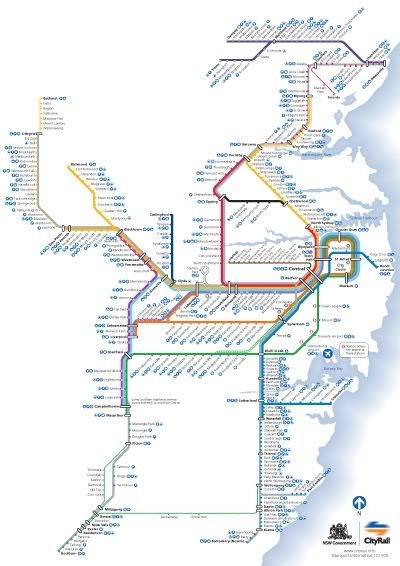
• Information - CityRail network map
A geographical map simplified using minimal angled lines and an effective colour scheme.
Photobucket

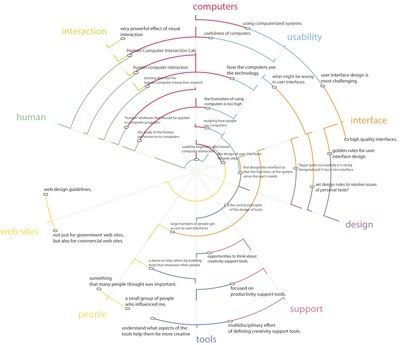
• Information - Ben Shneiderman interview analysis
A clear and simple graph effectively displaying a large amount of data within a small area.


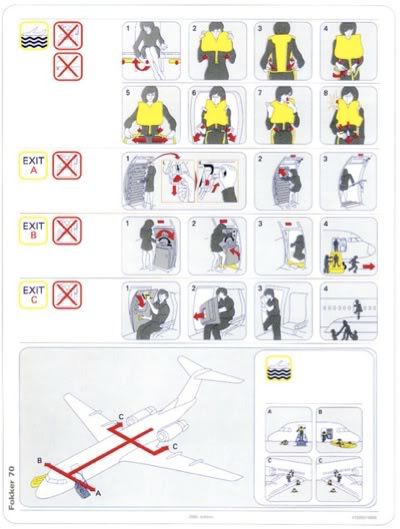
• Instructional - Airplane safety instructions
Classic and recognisable instructions that are universal to all users regardless of cultural background.
Photobucket

Friday, March 13, 2009

Defining Information/Instructional Design

Information design is a discipline of graphic design that largely focuses upon the effective expression of information, with a secondary objective do so in an attractive manner. It refers to the ability to visually depict data in such a way that audiences can readily interpret and comprehend the presented information. Designers employ qualities such as visualisation skills, creativity and understanding, through processes including communication, research, testing and computer rendering.

Instructional design refers to the creation of tools and methods that will communicate information to allow a user to learn in the most effective manner. Although similar to information design, this area more so focuses upon addressing the requirements of the learner in order to reach a set objective. A common model for instructional design is the ADDIE model:

• Analyse - identify and analyse learning problems, goals/objectives and needs of the audience
• Design - creation storyboards and prototypes, determine graphic design and user interface
• Develop - actual creation of learning materials developed in design process
• Implement - distribute material to student group
• Evaluate - testing and feedback from users
Developing a Mood Board

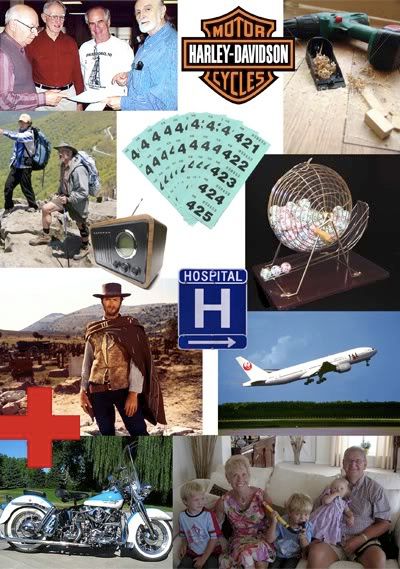
A mood board is a attempt to outline a persona (often the user) in a visual form in order to quickly gain an insight or feel for that certain personality. They can contain basically anything related to that persona such as clothing preference, colours, favourite food, emotions, etc.
The following is a description of the fictitious user, 'Johnny Smith' and the mood board for his personality:
"John is a 75-year-old retired carpenter who still enjoys hikes in national parks and ridding his Harley-Davidson. He looks forward to the local club raffle and a catch up with the boys on a Thursday evening. He also enjoys playing bingo, listening to local radio and watching old western movies with his wife Jill. As he gets older and has to visit the hospital more often, he prefers quick and efficient healthcare with simple, bold instructions and hospital signs. He aims to enjoy the rest of his life traveling a little and spending time with family, especially his grandchildren."

Photobucket

Developing a Storyboard

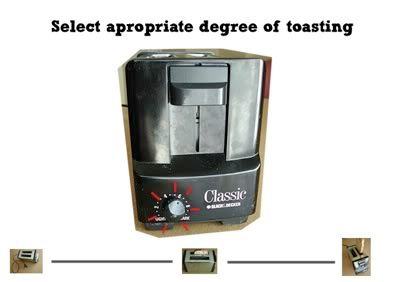
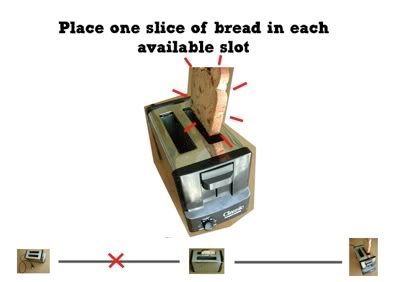
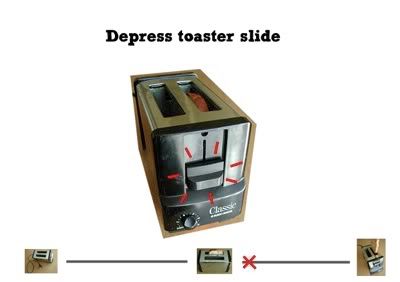
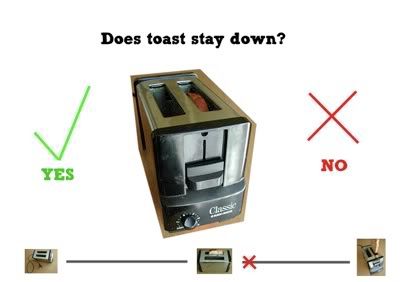
Storyboards are used in order to visualise a 'narrative' or in the case of interactive design, the process by which the user interacts with the product. A storyboard is not a final product and therefore can consist of quick drawings or pictures depicting an idea or objective. The following is an example of a few frames from a storyboard developed for a website depicting the process of cooking toast.

Photobucket
• Important parts of the image will become a button to navigate to the next step.
• When moused over, the button will highlight.
Photobucket
• The bottom graphics will demonstrate the point at which the user is at (timeline).
• A marker will progress as the user goes through each step.
Photobucket
Photobucket
• When decisions need to be made, the button within the image will navigate to the same page with a yes/no choice.
• Each decision will lead to the appropriate page.

Thursday, March 12, 2009

Developing a Visual Flowchart

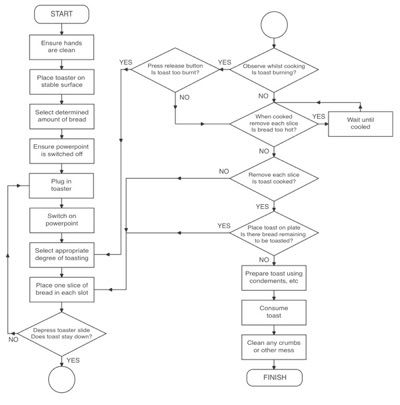
Visualisation of textual information helps the designer to fully realise each step involved within the interaction and to plan for all possible outcomes.
The following is an example of a flow chart depicting the method of cooking toast.

Photobucket

Planning Textual Steps

Recording the steps involved with the use of a product is the first part of designing for the interaction of its users. The following example lists the required actions and possible problems encountered whilst making toast:

• Place toaster on stable surface.
• Plug in toaster.
• Switch on power.
• Select settings to determine degree of toasting.
• Ensure hands are clean.
• Select the determined amount of bread needed.
• Place one slice of bread in each available slot.
• Depress slide on toaster. (Does toast stay down?)
• Observe whilst cooking. (Is toast burning?)
• When cooked wait for toast to be cool enough to touch. (Is toast too hot?)
• Remove each slice. (Is toast cooked?)
• Place toast on plate. (Is there remaining bread to toast?)
• Clean any bread crumbs.
• Prepare toast.

Wednesday, March 11, 2009

Interactive Web Design Examples

The following examples of great interactive web design fulfill their purposes extremely effectively:

http://frostdesign.com.au/ - The perfect balance of minimal visual design and rich content. The whole site is based around a visual interactive navigation system that provides the site with a uniform style, which immerses the user within the experience.
http://ciid.dk/ - An attractive yet simple flash web design that is easy to navigate and rich in information.
http://www.moma.org/ - A somewhat complicated website that displays a lot of information within each page. The layout, choice of colours and uniform style however reduces the stress on the user and unclutters the site, making it easy to use.
http://www.madebysofa.com/ - The main strength of this site lies within its simple layout and use of font/colour. All elements are clear, understandable and very easy on the eye.
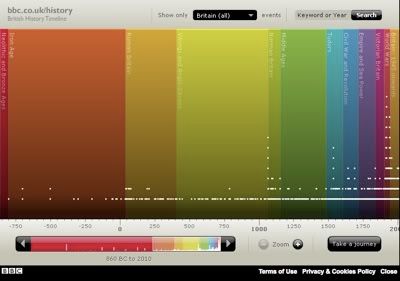
http://www.bbc.co.uk/history/interactive/timelines/british/ - An original and immersing application of interactive design used to display a timeline. Not only does it involve users but it also effectively displays a huge amount of information within a small space.

Photobucket